7 min read • in about 9 hours
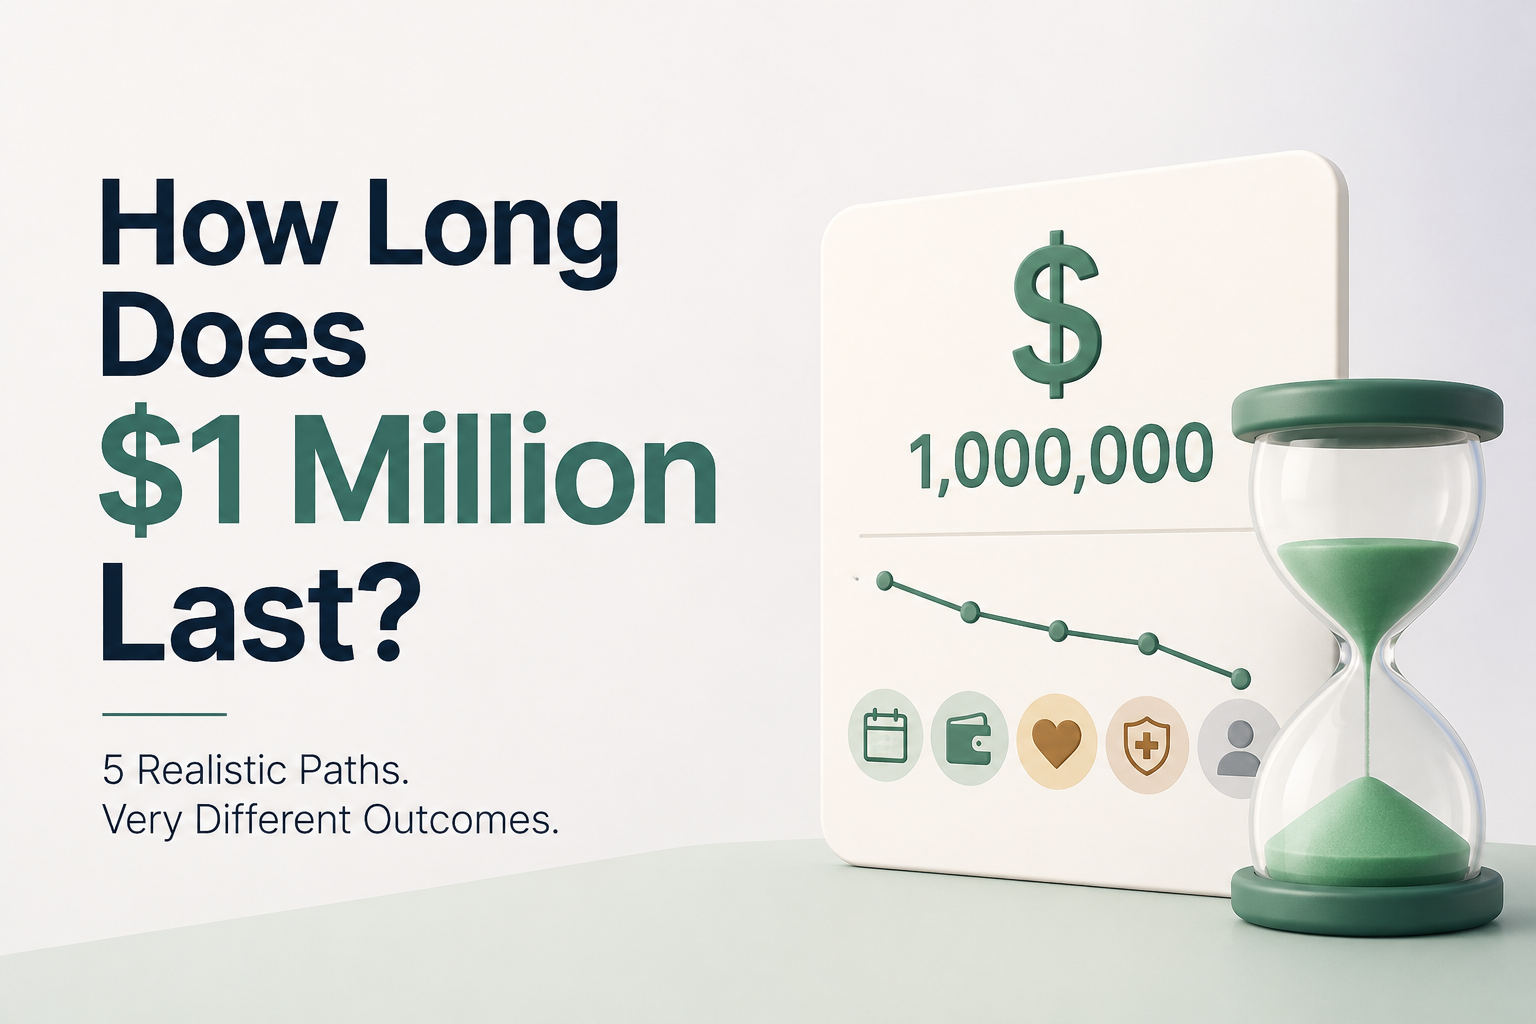
For many people, $1 million feels like the retirement milestone.
But the real question is not whether $1 million sounds like enough.
The real question is:
How long can $1 million support the retirement lifestyle you want?
For one household, $1 million may last a lifetime.
For another, it may run out much earlier.
The difference usually comes down to spending, retirement age, Social Security timing, healthcare costs, and whether any income continues after retirement.
Here is a simplified comparison of how long $1 million might last under different retirement paths.
| Retirement Path | Retirement Age | Monthly Spending | Social Security | Other Income | Possible Outcome |
|---|---|---|---|---|---|
| High-Spend Early Retirement | 60 | $10,000 | Claim at 62 | $0 | 12–15 years |
| Balanced Retirement | 65 | $7,000 | Claim at 67 | $0 | 25–30 years |
| Conservative Retirement | 67 | $5,000 | Claim at 70 | $0 | 30+ years |
| Part-Time Bridge | 60 | $8,000 | Claim at 67 | $2,000/mo | 25+ years |
| Spouse Keeps Working | 60 | $8,000 | Claim later | $5,000/mo | Stronger longevity |
These are not exact predictions.
They are examples showing why the same $1 million can produce very different outcomes.
The fastest way to change how long $1 million lasts is to change monthly spending.
| Monthly Spending | Annual Spending | Impact on $1 Million |
|---|---|---|
| $5,000 | $60,000 | Lower pressure on portfolio |
| $7,000 | $84,000 | Moderate withdrawal pressure |
| $10,000 | $120,000 | High withdrawal pressure |
| $12,000 | $144,000 | Very high withdrawal pressure |
A household spending $5,000 per month needs far less from its portfolio than a household spending $10,000 per month.
That sounds obvious, but many retirement plans fail because spending assumptions are too vague.
Retiring at 60 is very different from retiring at 67.
| Retirement Age | Years Before Age 90 | Planning Challenge |
|---|---|---|
| 60 | 30 years | Long retirement, more bridge years |
| 62 | 28 years | Early Social Security decision pressure |
| 65 | 25 years | Medicare begins, fewer bridge years |
| 67 | 23 years | Full retirement age range for many |
| 70 | 20 years | More time to save, fewer withdrawal years |
The earlier you retire, the longer your portfolio must last.
That means $1 million at age 60 is not the same as $1 million at age 67.
Social Security can reduce how much you need to withdraw from your portfolio.
| Claiming Strategy | Near-Term Income | Later Income | Portfolio Impact |
|---|---|---|---|
| Claim at 62 | Higher early income | Lower long-term benefit | Reduces early withdrawals |
| Claim at 67 | Balanced timing | Moderate benefit | Middle-ground strategy |
| Claim at 70 | Lower early income | Higher long-term benefit | May improve later-life security |
There is no single best claiming age for everyone.
The right choice depends on your portfolio, income needs, spouse strategy, health, and retirement goals.
Healthcare is one of the most underestimated retirement costs.
This matters especially before Medicare begins at 65.
| Situation | Potential Healthcare Impact |
|---|---|
| Retire at 60 with no employer coverage | Higher out-of-pocket or marketplace costs |
| Retire at 60 while spouse keeps working | Employer plan may reduce pressure |
| Retire at 65 or later | Medicare may lower uncertainty |
| Higher medical needs | More cash flow pressure |
A plan that looks strong before healthcare costs may look very different once those costs are included.
Instead of asking one question, compare multiple paths.
| Factor | Assumption |
|---|---|
| Retirement Age | 67 |
| Monthly Spending | $5,000 |
| Social Security | Claim at 70 |
| Result | Portfolio may last 30+ years |
This path prioritizes long-term security and lower spending.
| Factor | Assumption |
|---|---|
| Retirement Age | 65 |
| Monthly Spending | $7,000 |
| Social Security | Claim at 67 |
| Result | Portfolio may last 25–30 years |
This path balances lifestyle and portfolio protection.
| Factor | Assumption |
|---|---|
| Retirement Age | 60 |
| Monthly Spending | $10,000 |
| Social Security | Claim at 62 |
| Result | Portfolio may decline much faster |
This path gives more freedom earlier but creates higher risk.
| Factor | Assumption |
|---|---|
| Retirement Age | 60 |
| Monthly Spending | $8,000 |
| Part-Time Income | $2,000/month |
| Social Security | Claim at 67 |
| Result | Portfolio longevity may improve significantly |
Even modest income can reduce withdrawals during critical years.
| Factor | Assumption |
|---|---|
| One Spouse Retires | 60 |
| Other Spouse Works | Until 65 or later |
| Healthcare | Possibly covered by employer plan |
| Result | Stronger cash flow and reduced portfolio pressure |
This path can be powerful because it combines income, healthcare coverage, and delayed claiming flexibility.
Instead of asking:
How long does $1 million last?
Ask:
Which retirement path makes $1 million last while still supporting the life I want?
That question is more useful because it turns retirement planning into a set of choices.
Those choices include:
Nestly Lab helps you compare multiple retirement paths side by side.
You can test:
AI then ranks each path based on retirement income, success probability, portfolio longevity, and long-term sustainability.
Because the goal is not simply to make $1 million last longer.
It is to find the future path that gives you confidence, flexibility, and the retirement lifestyle you actually want.
Many retirees focus on how much they've saved, but the real question is how much they can safely spend. Learn how to evaluate retirement spending strategies and understand the tradeoffs.
Wondering if you're on track for retirement at age 50? Learn common retirement savings benchmarks, what counts as retirement savings, and how to evaluate your readiness.
Many couples claim Social Security at the same age without realizing it may reduce lifetime benefits. Learn how coordinated claiming strategies can improve retirement income and long-term financial outcomes.